Life cycle assessment of food and cosmetic products: a practical guide
Updated October 2026.
Retailers, investors and regulators now ask for the environmental footprint of each product, not only of the company. A life cycle assessment (LCA) answers that question, provided it is fed with the right data. Here is a practical method for food and cosmetic manufacturers.
What a life cycle assessment measures
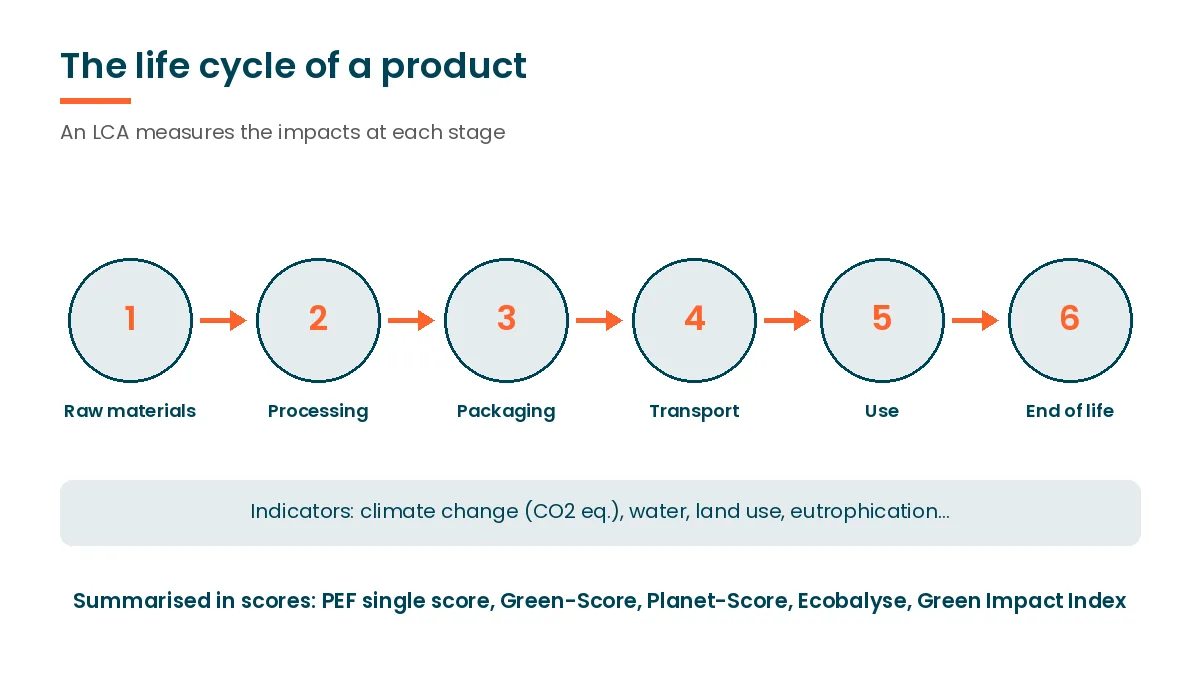
An LCA measures the impacts of a product at each stage of its life: raw materials, processing, packaging, transport, use and end of life. It is multi-criteria: climate change in CO2 equivalent, but also water use, land use or eutrophication. The European PEF method (Product Environmental Footprint) defines how these indicators are calculated and weighted into a single score.
1. Start from the data you already have
The LCA of a product is built from its recipe, its raw materials, its packaging and its processes: the data your R&D, purchasing and packaging teams already manage. Keeping it in the same system avoids recalculating everything by hand when a recipe changes.
2. Use reference databases for raw materials
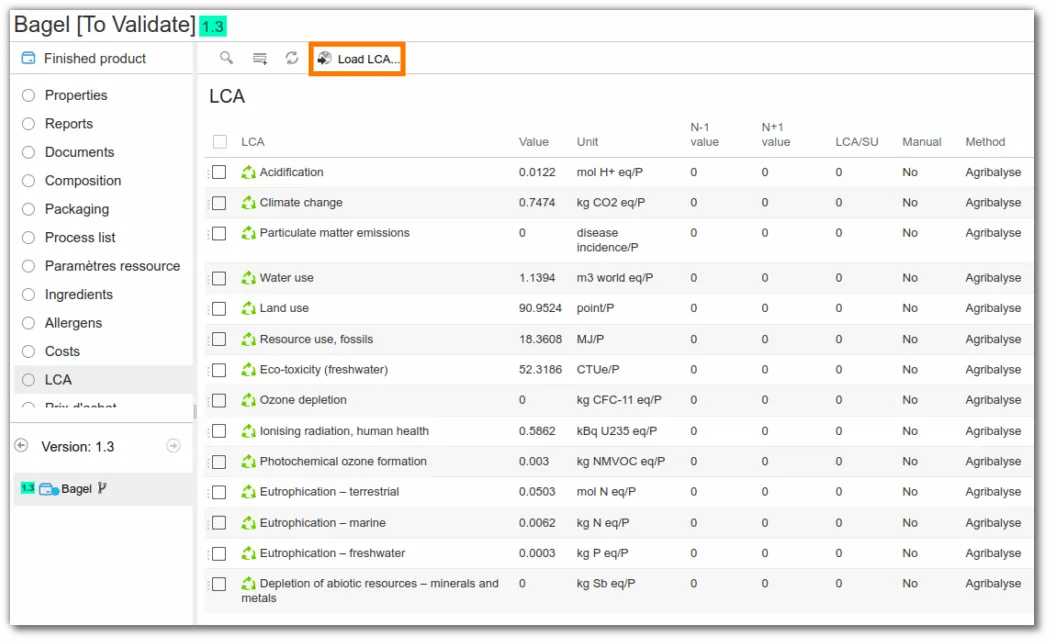
For agricultural raw materials, French manufacturers use Agribalyse, the ADEME database, which gives LCA indicators per ingredient. Import it on your raw materials, then replace a generic value with a supplier-specific one when you have it.
3. Calculate the product, not only the ingredients
The impact of the finished product adds up its ingredients in their real proportions, the packaging per sales unit and the processes. This is where a PLM helps: when the recipe or the packaging changes, the LCA is recalculated with it.
Primary or secondary data?
| Data | Advantages | Limits |
|---|---|---|
| Secondary (databases such as Agribalyse) | Available at once, comparable | Average values, not your own supply chain |
| Primary (your suppliers, your plants) | Reflects your real practices | Takes time to collect and check |
Start with secondary data for the whole range, then replace it with primary data where it matters most: the ingredients and packaging that weigh the most in the result.
4. Communicate with the right score
An LCA is detailed; consumers and customers expect a summary. Several scores exist, and each has its own rules:
| Score | For | Based on |
|---|---|---|
| PEF single score | Food and non-food | European PEF method |
| Green-Score (formerly Eco-Score) | Food | Agribalyse category, labels, origins, packaging |
| Planet-Score | Food | Its own method, including pesticides and biodiversity |
| Ecobalyse | Food, French environmental labeling | Public calculation of the environmental cost |
| Green Impact Index | Cosmetics | Formula and packaging |
5. Eco-design: compare before you decide
The real value of an LCA is upstream: compare two recipes, two origins or two packagings before launch, and see the impact next to the cost and the Nutri-Score. Packaging often makes a large share of the difference; see our guide on structuring your packaging data for the PPWR.
The usual eco-design levers
- Ingredients: for most food products, the agricultural stage weighs the most; changing an ingredient, its origin or its quantity often has the largest effect;
- Packaging: less material, recycled or recyclable material, fewer packaging levels;
- Processing: energy and water used by the line, and losses, which waste everything upstream;
- Transport: distance and mode, especially for chilled or frozen products.
What to look for in LCA software
- calculation from your recipes, packaging and processes, not from a separate spreadsheet;
- import of reference databases such as Agribalyse, and your own primary data;
- the PEF method and your own indicators;
- automatic recalculation when a recipe, a supplier or a packaging changes;
- comparison of scenarios before launch, next to cost and nutrition;
- reporting by product family, site or origin.
Frequently asked questions
What is the difference between an LCA and a carbon footprint?
A carbon footprint measures one indicator, climate change. An LCA measures several impacts at once, which avoids improving one at the expense of another.
Is a product LCA mandatory?
There is no general obligation to publish a product LCA, but retailer requests, sustainability reporting and environmental labeling schemes increasingly rely on LCA data.
Which database should I use for food ingredients?
In France, Agribalyse is the public reference, provided by ADEME. Use it as a starting point, then add your suppliers’ data where you have it.
How long does an LCA take?
Collecting and checking the data takes most of the time. Once the data is in the PLM, the LCA of each product is recalculated automatically with its recipe and packaging.
In beCPG
beCPG calculates the LCA of each product from its raw materials, recipe, packaging and processes, with your own indicators and the PEF method, imports Agribalyse data, and calculates the Green-Score, Planet-Score, Ecobalyse and the Green Impact Index with the detail of each calculation. Discover packaging and eco-design in beCPG.