PLM supports product design and development, while ERP handles day-to-day operations such as purchasing, production and inventory. The two systems need to exchange data to avoid retyping and inconsistencies.
Choosing food PLM software takes more than comparing feature lists. Several criteria matter, depending on your business: formulation, nutrition calculation, allergen management, regulatory compliance, supplier collaboration and more. How do you compare vendors and find the one that fits your organization? Here are ten criteria to review.
In the United States, nine major food allergens must be declared on the label: milk, eggs, fish, crustacean shellfish, tree nuts, peanuts, wheat, soybeans and sesame. The law sets how to declare them, in the ingredient list or in a “Contains” statement. Unlike the declaration of allergens present as ingredients, precautionary statements such as “may contain” are not subject to specific presentation rules. The FDA still reminds manufacturers that they must not be misleading. And the FDA guidance of January 2025 changed the scope of milk, eggs and tree nuts.
“Can we sell this in Brazil?” The question comes from sales, lands on the regulatory desk, and the honest answer is often “give me a week”. A good part of that week goes into one precise question: how many warning symbols will the product have to carry on the front of pack, and in which countries.
On many packs, “may contain traces of…” has become a reflex: you write it because you cannot quantify the risk. Allergic consumers end up ignoring it, or giving up products they could safely eat. Regulators and international standards are now pushing the other way: a precautionary statement that rests on a calculation, product by product. The question is where the numbers come from.
In Australia and New Zealand, the front of pack carries stars: from half a star to five, in half-star steps. The system is voluntary, which does not make it optional: shoppers compare stars on shelf, and a range that displays nothing reads as a range with something to hide. The question is how many stars your product earns, and what it would take to gain one.
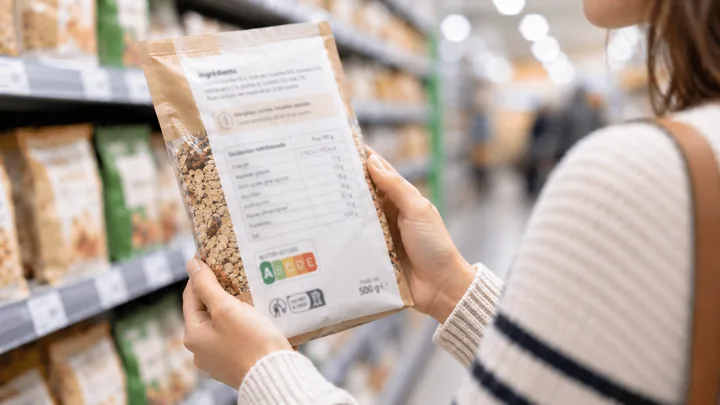
The same drink: rated E in France, D in Singapore, carrying black octagons in Chile, traffic lights in the United Kingdom and one and a half stars in Australia. The product did not change — only the country it is sold in did. For an R&D team the hard part is not computing a score. It is knowing which one will move when the recipe does.
The recipe changes in R&D, the label follows, quality signs it off. Three weeks later, the page for that same product on the retailer’s website still shows the old allergen list — and that is the one shoppers read. The discrepancy appears on none of your screens. It appears only on theirs.
The spreadsheet cost nothing to install, and that is exactly what makes its cost so hard to see. It appears on no budget line: it is spread across your formulators’ hours, the checks made before every send, and the rework that follows an error. Before comparing anything to anything, you have to put a figure on it. Here is how to do that with your own numbers.
The new beCPG 23.4 version is here, bringing a host of innovations designed to make document management, compliance and collaboration even more efficient. The goal: simplify daily work, strengthen data…