Support
Incident Manager
beCPG provides an incident manager accessible at this address:
A project is dedicated to you. You can create requests to report issues or ask for assistance.
Monitoring the application
If you want to monitor the application, the important metrics are:
- The size of the disk (df -h)
- Available memory on the server (no swapping) (top)
- Java heap size and memory overflow errors (docker compose logs)
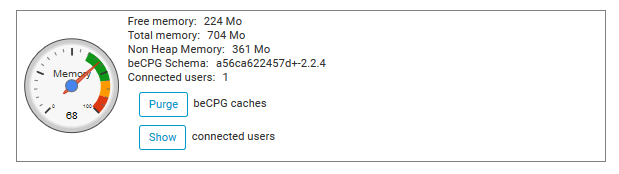
In the beCPG administration, you also have access to the Java memory usage and the connected users:
[SERVER ADDRESS]/share/page/console/admin-console/becpg-admin
You can also use the support tools.
Note:
Is it a concern if the gauge is red?
This is not a concern when the used RAM is lower than the RAM allocated to beCPG. The system uses more RAM, up to 2 GB, when necessary. The gauge goes back to green or orange later. If the system consumes 2 GB, the administrator must allocate more than 2 GB to beCPG.
[SERVER ADDRESS]/alfresco/s/ootbee/admin/admin-performance
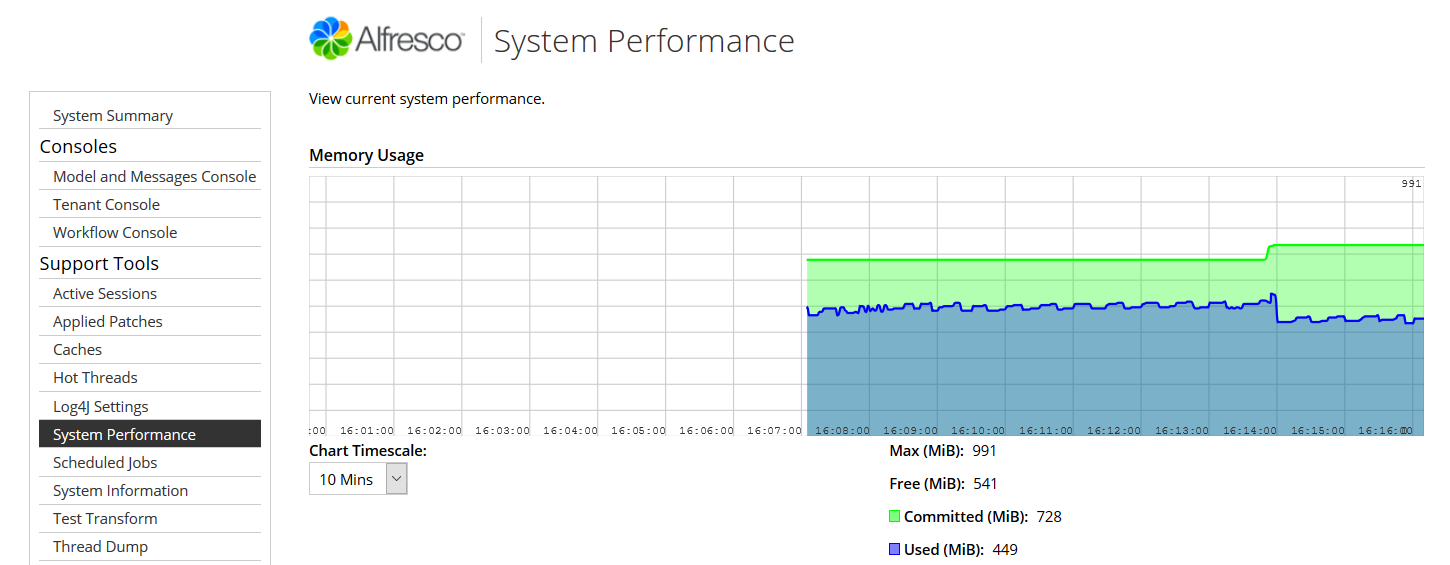
On the server, you can use Docker to see the memory used by each container.
cd /opt/becpg-srv-instances/inst1
./tools/instance.sh stats
You can also use top.
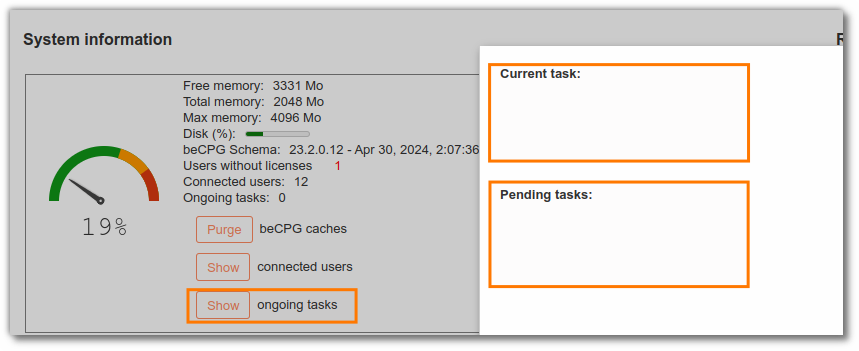
View and cancel current tasks:
Access to Logs
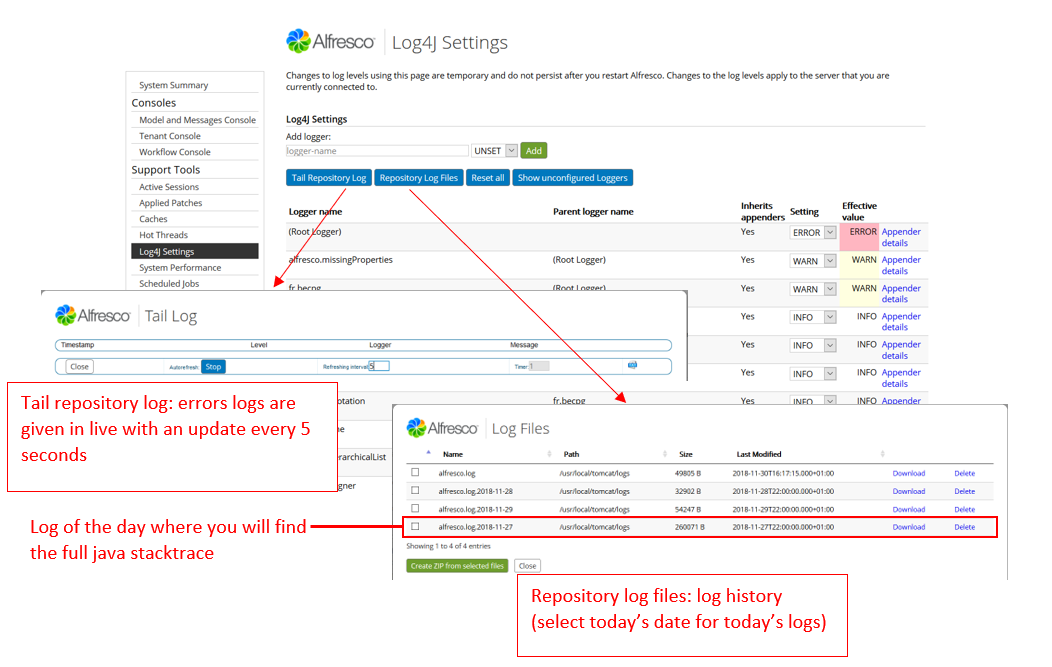
It is possible to access the logs through the web client using the following link:
[SERVER ADDRESS]/alfresco/s/ootbee/admin/log4j-loggers
Then, click "Tail Repository Log" to access the logs directly (see image below):
Report an issue to the support team
The available tools let you get details on the issues or error messages you encounter.
This documentation has been written for Firefox.
Here is how to proceed if there is an error message.
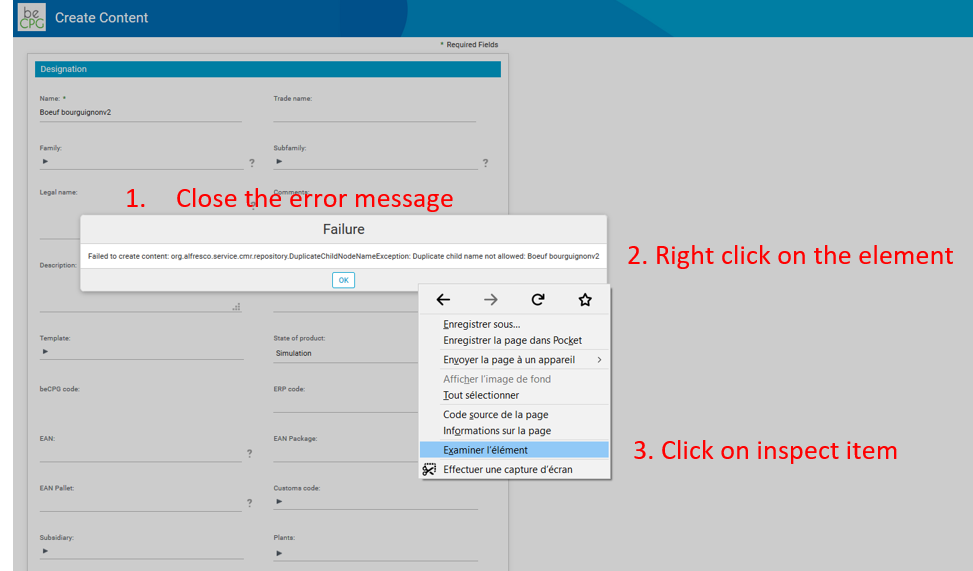
Use the inspector in your browser:
- Close the error window.
- Right-click the entity/the page.
- Click "Inspect" (or press F12).
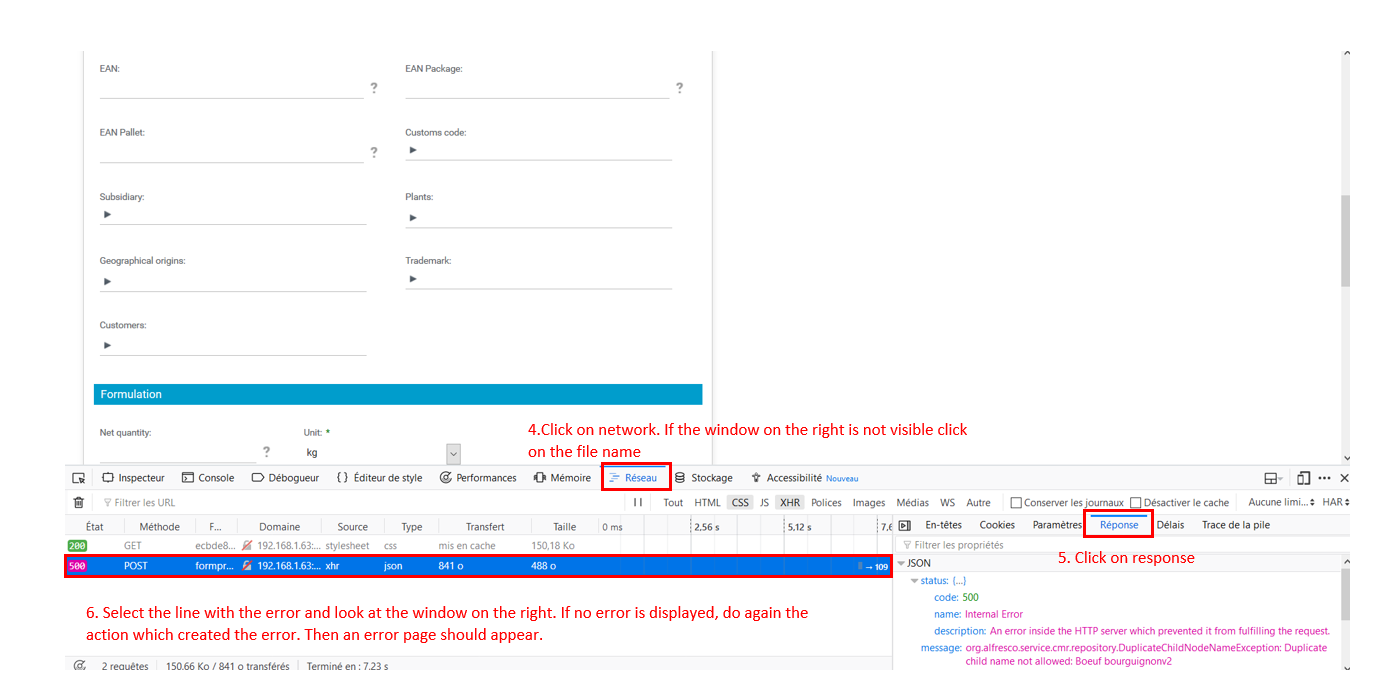
- Select "Network".
- Select a line: a panel opens on the right of your screen.
- Select "Response": the details of the errors are displayed here.
- Select the line in error (or perform the action that generated the error again).
- Read the error message.
Use the logs:
- Open the logs of the day.
- Find your error (use the timestamp).
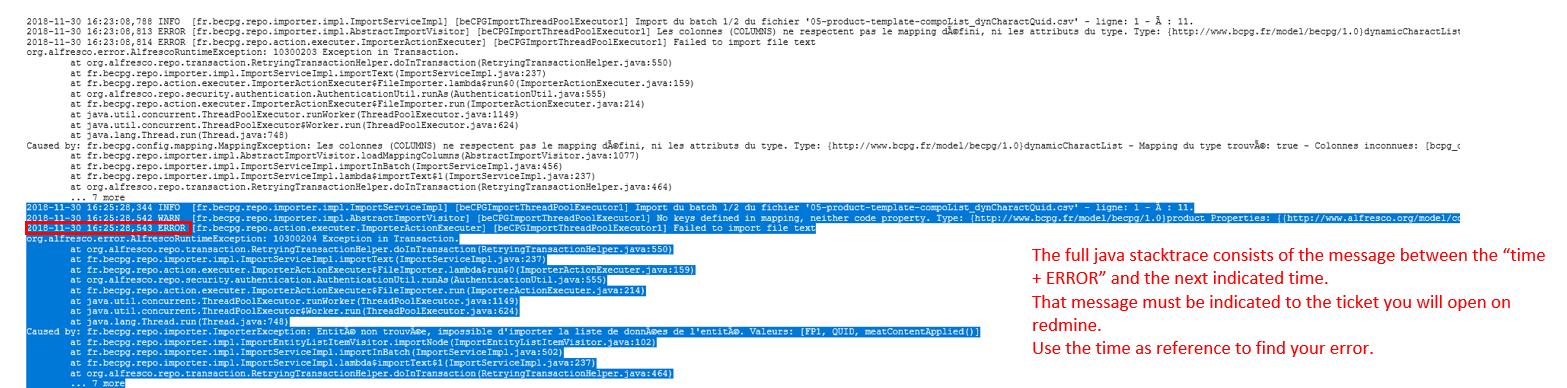
- Copy and paste the error into a support ticket.